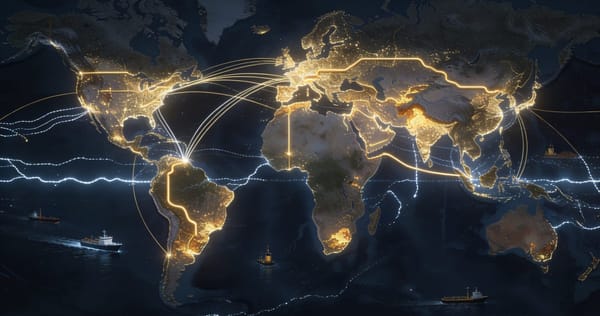
The Global Supply Map
A simple map of the trade corridors, ports, and chokepoints that quietly move the global economy.

Ledger Report
Most of the world’s economy moves through places you’ve probably never thought about.
———
Ports. Narrow straits between continents. Rail corridors cutting across vast landmasses. Pipelines running thousands of miles underground. Data cables laid across the ocean floor.
Together, they form the physical backbone of global trade.
When people talk about “supply chains,” it can sound abstract — like an invisible web connecting factories and consumers across the planet.
But in reality, the system is surprisingly concrete.
Goods move through very specific pathways.
Ships follow well-established maritime routes across the oceans. Containers pass through a relatively small number of major ports. Energy flows through pipelines and tanker routes that connect producing regions with the countries that need it most.
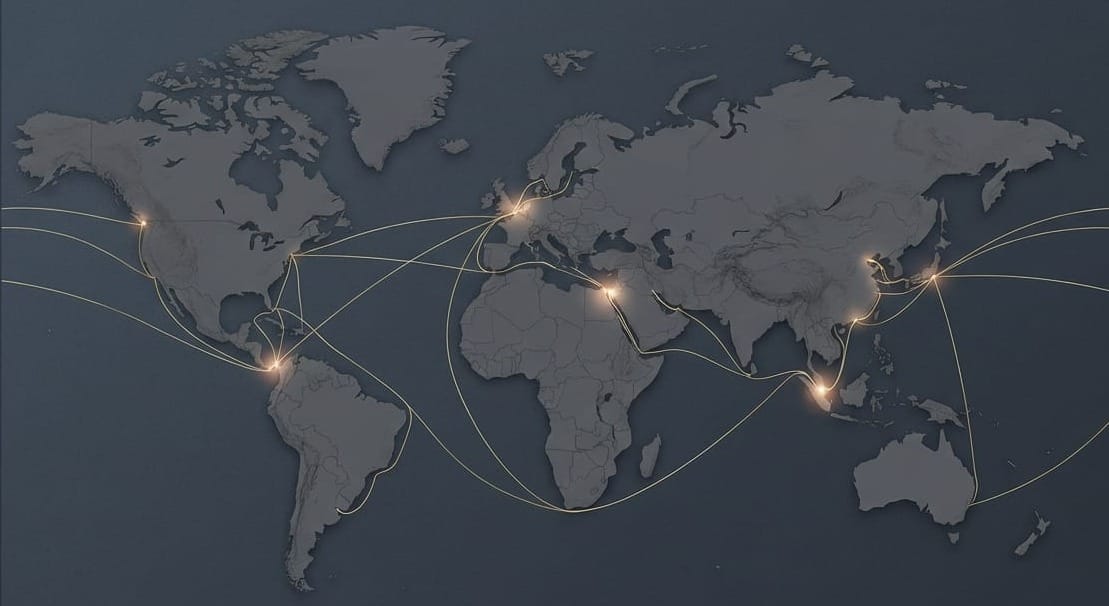
In other words, global trade isn’t evenly distributed across the map.
It runs through corridors.
And some of those corridors are incredibly narrow.
The Corridors of Global Trade
Take the Strait of Malacca, a thin passage between Malaysia and Indonesia. A huge portion of the world’s shipping traffic passes through this single stretch of water each year.
Or the Suez Canal, which allows ships to move between Europe and Asia without sailing all the way around Africa. When that route is blocked — even briefly — the effects ripple across the entire global economy.
Energy follows similar patterns.
Oil and natural gas move through pipelines stretching across continents and through tanker routes that connect the Middle East, North America, and other major producers with markets around the world.
Because energy powers transportation, manufacturing, and electricity, disruptions to these flows can quickly affect everything from shipping costs to food prices.
Industrial supply chains add another layer.
Many of the materials used in modern technology come from specific parts of the world. Rare earth minerals, metals, semiconductors, and other components often travel through several countries before becoming finished products.
The result is a system that looks complicated at first glance but becomes clearer when viewed on a map.
Trade moves through corridors.
Energy moves through pipelines and sea lanes.
Industries cluster around certain regions.
The purpose of the Global Supply Map is simply to make those structures visible.
Once you can see where the world’s supply routes run — and where they narrow — it becomes much easier to understand why certain geopolitical events matter, why shipping disruptions can move markets, and why infrastructure investments can quietly reshape the global economy.
The map doesn’t predict the future.
But it does show where the pressure points are.